What is Observability?
In control theory, observability is a measure of how well internal states of a system can be inferred from knowledge of its external outputs. In other words, this is your level of understanding the complexity of your system.
Observability is the ability to extract relevant information from the data that is being generated by orchestrated IT architectures and applications. Someone would ask, „Okay, but what exactly is this „data”?” To answer this question, let’s talk about pillars of Observability.
The main Pillars of Observability
Logs, metrics and traces are consider as a three core pillars of Observability. We will have a closer look on each of them below.
Logs
Log is an record of event with timestamp which occurred inside the application. Depending on system or application logs can be in different formats. You can find them nearly everywhere, for example they are located in /var/log/ on Linux distributions or in C:\WINDOWS\system32\config\ on Windows distributions. Let’s see the error log from our application gateway:
404 : [{“status”:”NOT_FOUND”,”timestamp”:”06-10-2020 02:56:20″,”message”:”PL951050013255758683364626915″,”debugMessage”:null}]
As You can see this log contain timestamp and information that some bank account number wasn’t found in data base.
Metrics
In opposite to Logs, Metrics aren’t just a single record of event but rather a numeric value that is measured over a specific period of time. Like Logs, metrics also have timestamp and can originate from countless sources including nodes, services, cloud platforms and many more. Some common examples of metrics include:
- average CPU usage in the last X minutes
- average RAM memory usage in the last X minutes
- average response time in the last X minutes
- number of requests in the last X minutes.
Distributed Tracing:
Trace is a collection of transactions which occurred on distributed applications. When your IT architecture is properly arranged the Trace enable you to analyze end-to-end flow of your microservice architecture by recording all requests – from your web service through backend to data-base. Let’s see below the overview of sample Trace from our simple architecture:
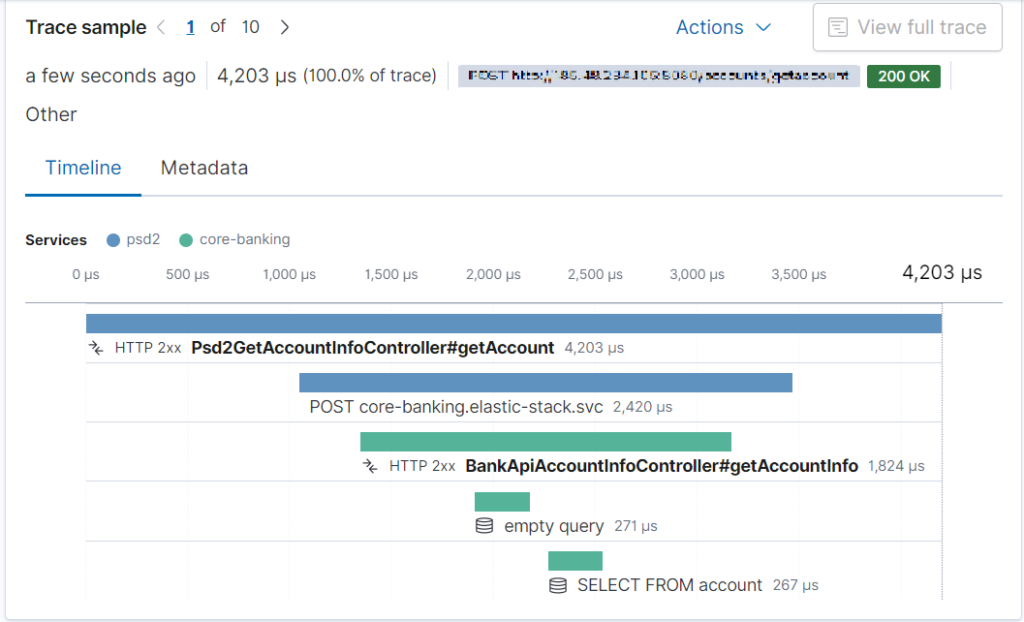
As you can see, we are getting lifespan of each transaction, response code, flow of the whole process and more. They way transactions connect each other is by passing the unique ID on every system call.
Thanks to that we can analyze exactly which part of the code is taking more time than it should, and fix the latency issue in no time.
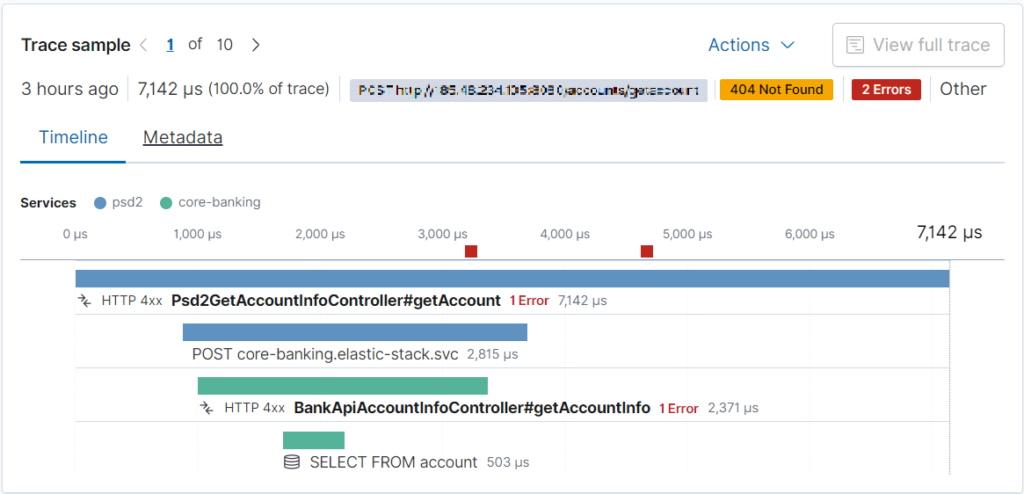
Moreover, we can exactly see where and when the error occurred, see below:
Observable System:
We explained the Three Pillars on which Observability is build. While they are enough, we can add more pillars like RUM, to make our Observable system even more sophisticated.
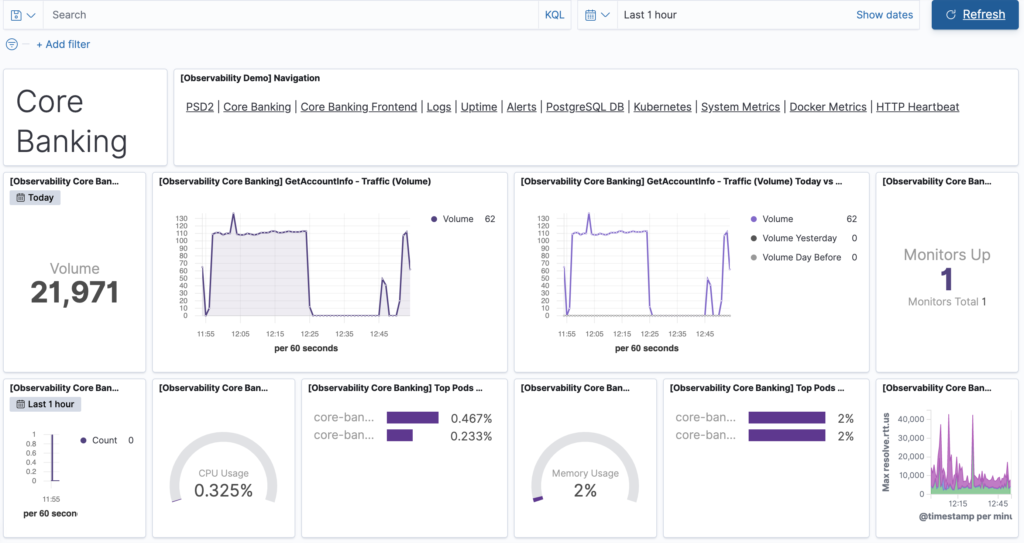
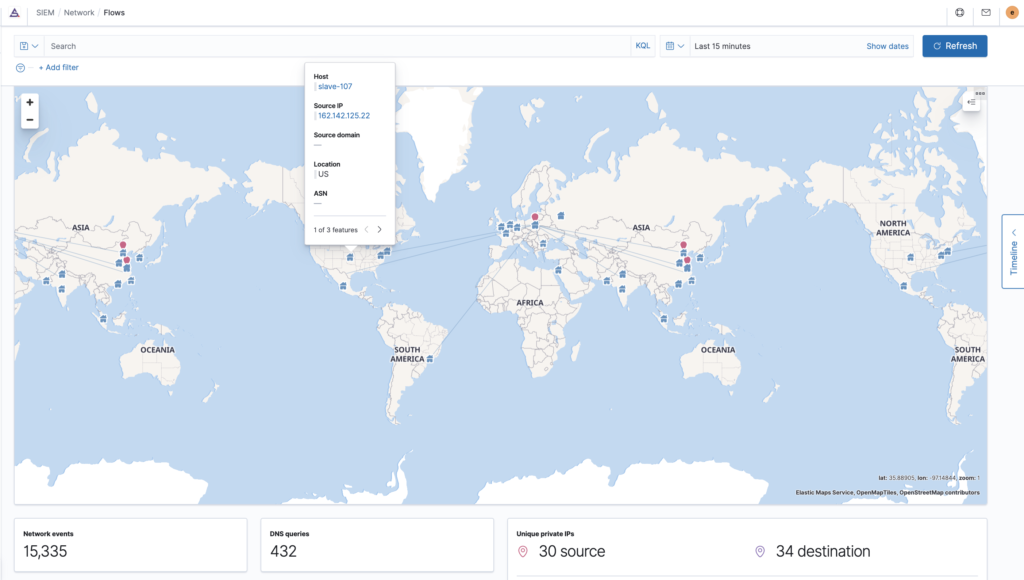
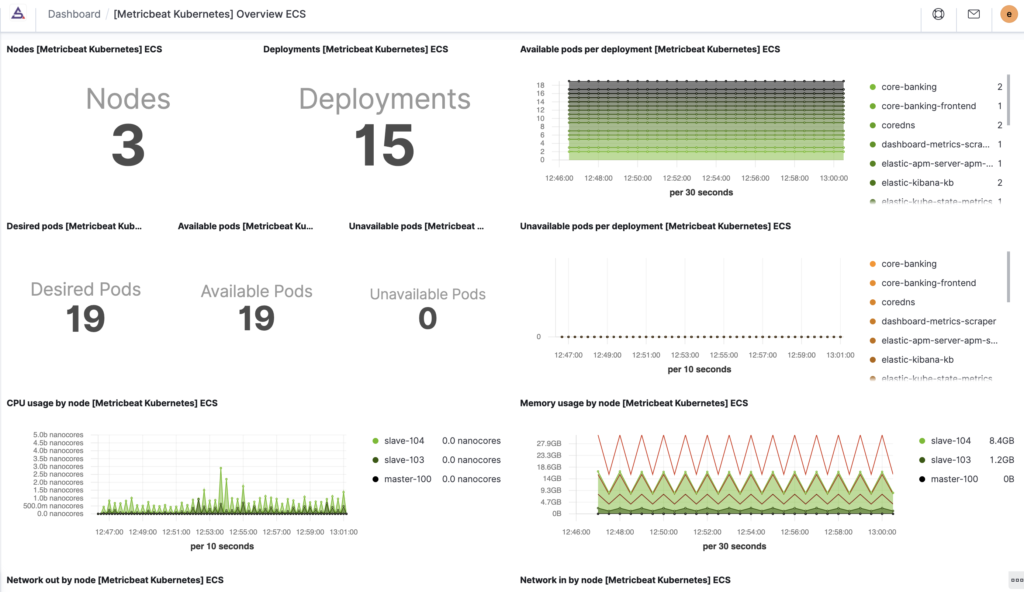
Obviously, Observability isn’t only about data itself, but rather what you are able to do with it. Let’s imagine that we already have a storage where we keep all Logs, Metrics and Traces generated from our microservice architecture. Acquiring the right information from this data-base would be almost impossible. That is why we need Dashboards and Visualizations. Dashboards are just collection of Visualizations with time selector, hence the Visualizations play a key role.
Choosing the right type of Logs/Metrics, applying filters on them and configuring the most suitable for your system type of representation are all highly skilled tasks that require extensive knowledge – well designed visualization can give you an answer for your issues right away
Please, have a look on our simple Kibana Dashboards below:
Summary, next Steps:
As your systems become more and more complex, it’s harder to get the comprehensive visibility of your architecture/application behavior. Consequently allotted time, money for debugging and maintaining your system is constantly increasing which has negative impact on a product that you want to develop.
Observability has become they key factor in producing the best software possible.
Is your organization ready to implement Observability and step up its DevOps game? – Contact us – Savigo’s experienced team will help you with that!